Local Debugger
The local debugger is a Visual Studio extension for that you can use to simplify debugging custom agents and Kepler services used in Relativity.
The setup for the local debugger takes approximately 10 minutes to complete per DevVM.
System requirements
Review the following system requirements for your DevVM and the local debugger extension.
DevVM requirements
Review the following requirements for your DevVM and resource file dlls:
- DevVM version - Make sure your DevVM is running
- Resource file dlls - Install your RAP file containing the Agent and Kepler Service dlls to the Application Library as a new application within the Relativity instance hosted on your DevVM.
- Notes:
- You don't need an agent running on your machine. To avoid confusion, we recommend disabling the agents that you want to debug through the local debugger within your Relativity instance.
- You don't need to update the resource files within your Relativity instance with the any dlls modified locally unless you added a new agent type to your dll.
Note: For new DevVMs, ensure that the DevVM is renamed in Hyper-V, so the name contains only hyphens instead of periods. This modification allows the VM to be trusted by and compatible with the local debugger. For example, rename RelativityDevVm-12.3.149.23 to RelativityDevVm-12-3-149-23 in Hyper-V.
Local Debugger requirements
Review the following requirements for the local debugger execution and validation:
- Run Visual Studio 2019 as Administrator.
- Set the extensibility point that you want to debug as the startup project in Visual Studio. Right-click on the project and select Set as Startup Project.
- Make sure that all extensibility point projects are using the latest SDK project format. Use these steps to verify the project format:
- Open the .csproj or .vbproj file. Verify that the Sdk attribute is set as follows:
- Verify that the following data required by the local debugger is also set in the project file:
Copy<Project Sdk="Microsoft.NET.Sdk">Copy<TargetFramework>xxxx</TargetFramework>
<OutputPath>xxxx</OutputPath>
<GenerateAssemblyInfo>false</GenerateAssemblyInfo>
<AppendTargetFrameworkToOutputPath>false</AppendTargetFrameworkToOutputPath
To convert your project, see Convert to the latest SDK project format.
For general information about project conversion, see the following web pages:
Download and install the Local Debugger extension
Use the following steps to download and install the VSIX package for the local debugger:
- Use one of the following options to download and install the extension:
- Visual Studio Marketplace - navigate to Visual Studio Marketplace and download the VSIX file called Relativity Local Debugger.
- Visual Studio - complete the following steps:
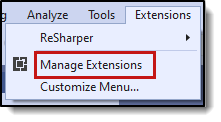
- Open Visual Studio and click Extensions > Manage Extensions.
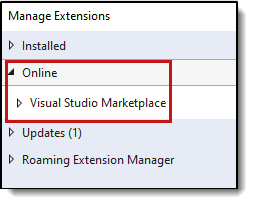
- Expand Visual Studio Marketplace.
- Search for the Relativity Local Debugger extension and install it.
Install the VSIX file by double-clicking on it in File Explorer and installing it through the VSIX installer.
- After the installation successfully completes, relaunch Visual Studio in Admin Mode.
- To verify that the extension is available in Visual Studio, click Extensions > Relativity - Local Debugger.
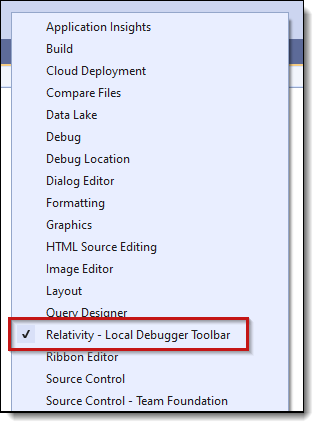
- If you don't see the extension, right-click in the toolbar section and select Relativity - Local Debugger Toolbar. You should now see the extension in Visual Studio.
- Verify that the toolbar displays No VM Set, and the Refresh Extensibility Projects button at the top of the UI.
(Click to expand)

Set up your DevVM environment
Use the following steps to set up the local environment on your DevVM for debugging:
- Set up your DevVM using the instructions in
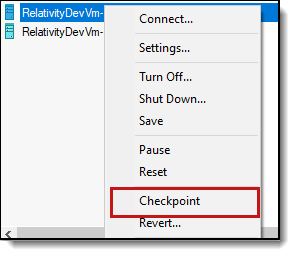
- Optionally create a checkpoint on Hyper-V after you set up your DevVM and before you complete the following steps. We recommend creating the checkpoint in case you want to revert to the original configuration of your VM.
-
To ensure your VM is trusted by and compatible with the local debugger, rename the DevVM in Hyper-V, so the name contains only hyphens instead of periods. For example, rename RelativityDevVm-12.3.149.23 to RelativityDevVm-12-3-149-23 in Hyper-V.
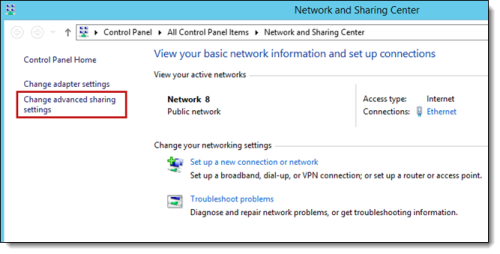
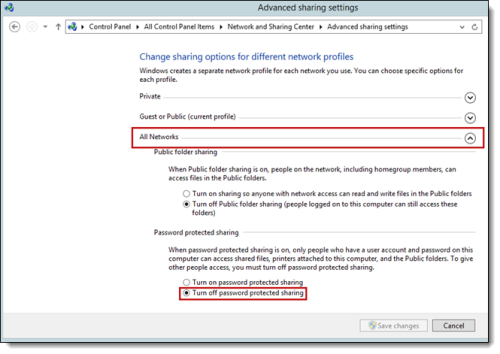
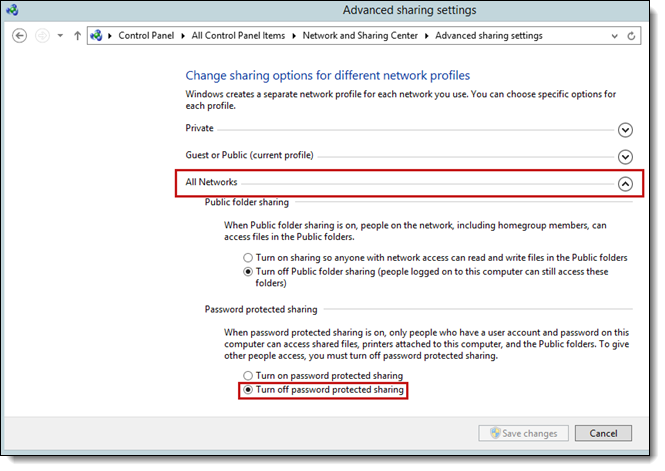
- To access the shared folders on your DevVM, turn off the password protected sharing option. Complete these steps on your DevVM:
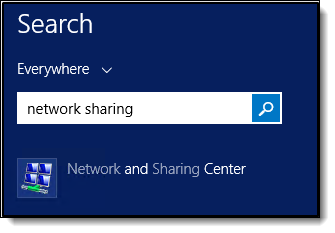
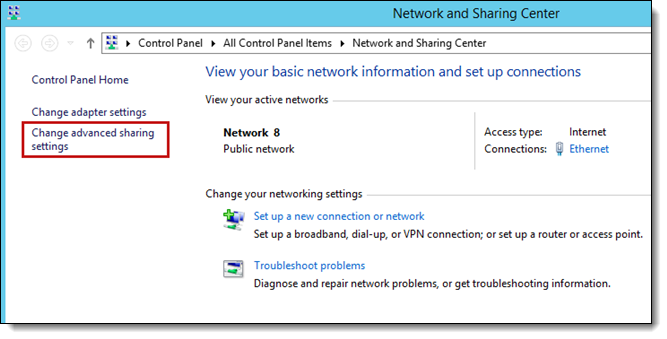
- Search for the Network and Sharing Center.
- Locate Change advanced sharing settings in the left pane.
- Expand All Networks and select Turn off password protected sharing. Click Save changes.
(Click to expand)
(Click to expand)
Debug using the Local Debugger
To start debugging with the local debugger extension, use the following steps.
- Verify that your DevVM is properly running before configuring your system for debugging. See Set up your DevVM environment.
- Configure the local debugger to run against your DevVM as follows:
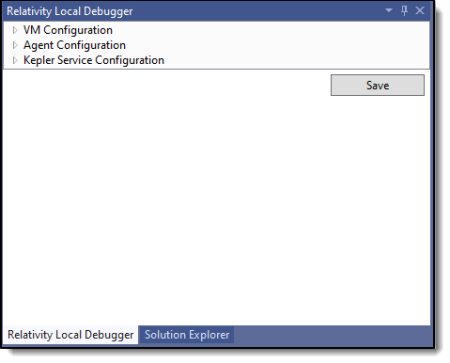
- In Visual Studio, click Extensions > Relativity - Local Debugger > Configure Agent Debugging.
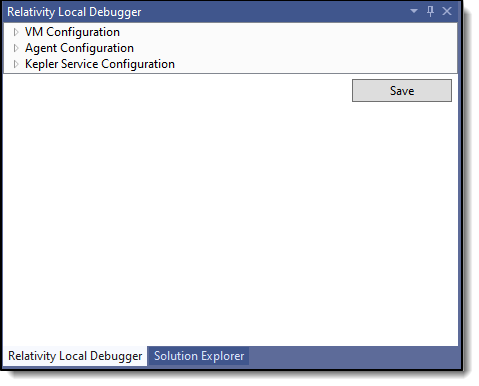
Verify that the Local Debugger Tool window is launched in the same pane as Solution Explorer:
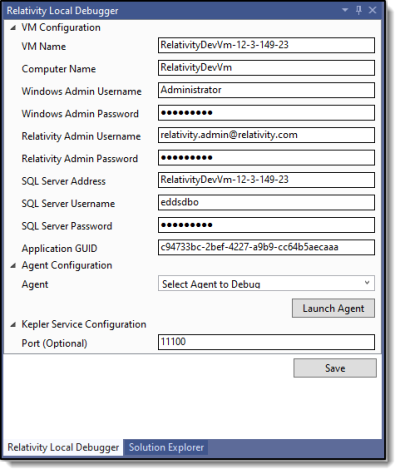
- Expand VM Configuration to display the following form:
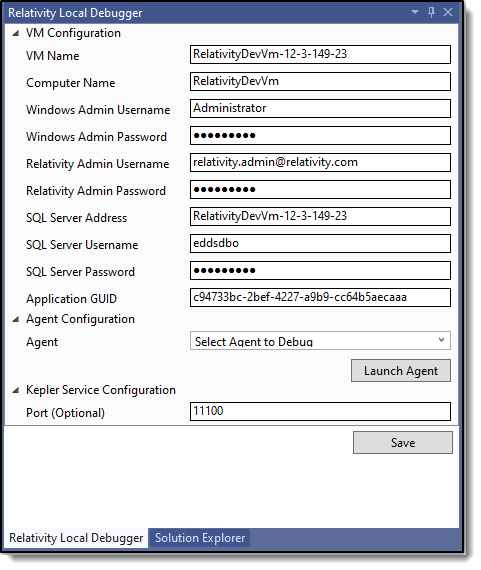
- Enter the following information about your DevVM in the form:
- Enter the VM Name and Computer Name.
- VM Name - RelativityDevVm-11-3-72-29
- Computer Name - RelativityDevVm
- Complete the following additional fields. For DevVM information, see Relativity DevVM Pre-built VM Documentation on GitHub.
- Windows Admin Username
- Windows Admin Password
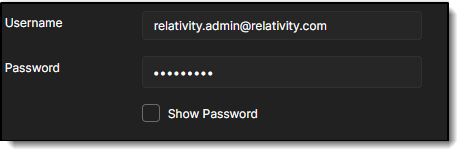
- Relativity Admin UserName
- Relativity Admin Password
- SQL Server Address
- SQL Server Username
- SQL Server Password
For example, if the DevVM currently installed on your local machine is named is RelativityDevVm-11-3-72-29 in Hyper-V, then enter the information on the Local Debugger Tool pane:
Note: The application GUID corresponds to the application installed on the Relativity instance hosted in your DevVM, which contains the resource file dlls of the extensibility points for debugging.
- Click Save to begin the configuration setup for agent debugging.
(Click to expand)
(Click to expand)
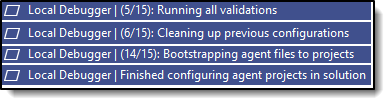
- Monitor the progress of configuration steps in the bottom Visual Studio window used for native Visual Studio steps. See the following examples:
-
Verify that you have received the following message: Finished configuring agent projects in solution. This message indicates that your system is ready for debugging.
After successfully configuring the VM, you can optionally connect to your Relativity instance URL through HTTPS and use the VM name as the instance domain instead of the IP Address.
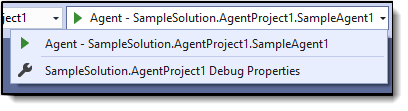
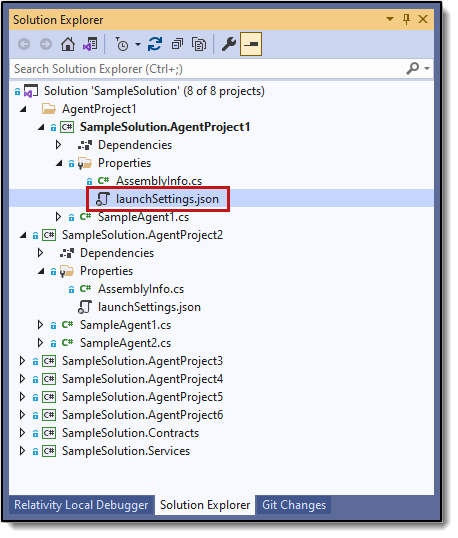
Copyhttps://RelativityDevVm-12.1.144.21/Relativity/ - Verify that debug profiles are available for each extensibility point project.
- Verify the launchSettings.json file appears under properties.
- Click the Debug or Run in the Test drop-down menu or press the F5 key to debug your selected extensibility point.
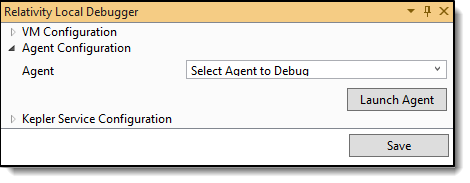
Alternatively, you can launch agents manually and debug them by using the Agent Configuration section in the Local Debugger tool pane. Select the agent you want to launch and then click Launch Agent.
- Notes:
- If you add or remove extensibility points in your solution, click the Refresh Extensibility Projects to re-generate the debug profiles for each extensibility point.
- If you add a new agent type to your dll or modify any contracts for your Kepler service, upload the updated dlls to your instance of Relativity through the Resource Files tab.
Note: If you don't complete this step, the pre-validation checks will identify this issue. You will have to start the DevVM before the configuration proceeds.
(Click to expand)
Note: Because a DevVM resets its IP address when you restart your local machine, we recommend running the configuration process after restarting the VM.
(Click to expand)
Debug Kepler service projects
With a Kepler service, you have options available when determining how to debug extensibility points. A Kepler service consists of hosted endpoints. Changing your startup project to the Kepler service, starts a hosted service, but no actions occur until you make a call to an endpoint.
Requirements for Kepler services
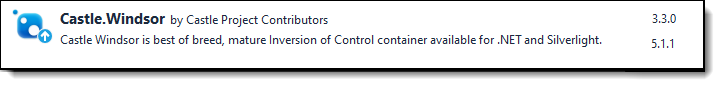
You need to install the Castle.Windsor 3.3.0 NuGet package in the project containing your Kepler service. You must install version 3.3.0 for the custom IWindsorInstaller implementations to register components successfully.
(Click to expand)
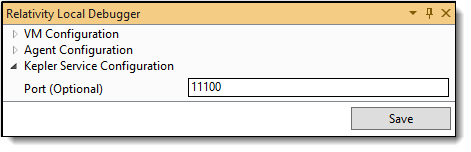
The default port for a Kepler service is 11100. If you want to use a different port for a Kepler service, update the port number in the Local Debugger tool pane. We recommend using a port number between 11000 - 20000. Click Save after making any changes in the tool pane.
Use a REST client
To make calls to endpoints on a Kepler service, you can use a REST client, such as Postman.
Use the following steps to make a REST call:
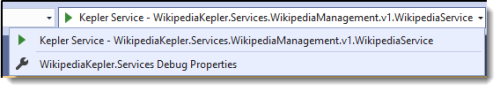
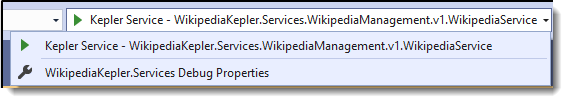
- Switch your startup project to a Kepler service. A profile with the name of your Kepler service displays if you completed the VM configuration and can start the service.
(Click to expand)
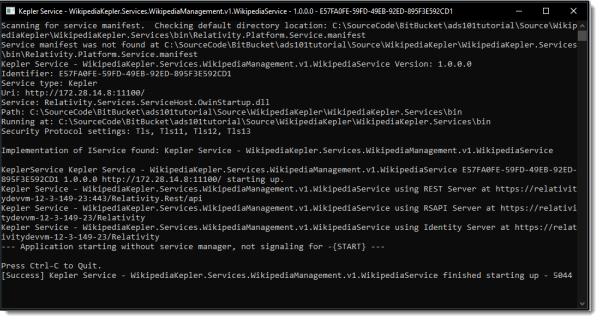
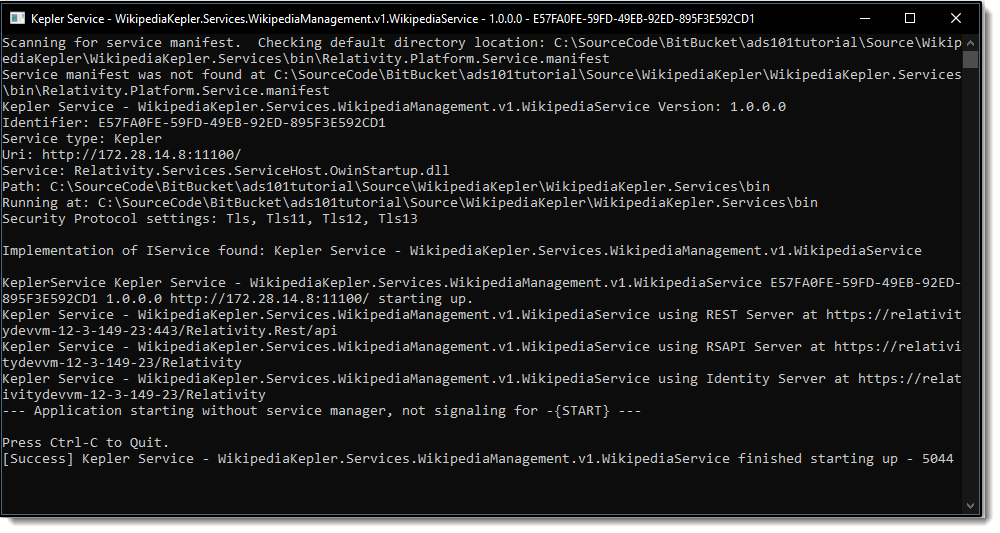
- Verify that you received the following messages after locally launching your Kepler Service.
(Click to expand)
- Make a call to your endpoint from your local REST client, such as Postman. Use the following steps:
- Use the URI shown in the command prompt in step 2, or use your local machine name. Don't use the DevVM name for this purpose.
- Use this general format: http://localMachineName:11100/.
- This example uses the format: http://172.28.14.8:11100/.
- For your locally hosted Kepler service don't use Relativity.REST in the path. Use a URL with the following format:
- Use Basic Authentication to make the REST call.
- Make sure you are sending the appropriate headers, payloads. and HTTP verbs to make the REST calls, such as GET, POST, or others.
Copyhttp://172.28.14.8:11100/api/ServiceModuleRoute/WebServiceRoute/FunctionRouteThis URL is like those used on other Relativity instances, except for the removal of Relativity.REST.
- Use the URI shown in the command prompt in step 2, or use your local machine name. Don't use the DevVM name for this purpose.
Manually launch agents against a hosted Kepler service
You can manually run agents against a locally hosted Kepler service.
- To test an agent against your locally hosted Kepler service, use the steps in Use a REST client.
- Select the agent to launch and click Launch Agent on the Agent Configuration section in the Local Debugger tool pane.
Use an agent that calls that a Kepler service
Use the following steps to debug multiple projects, such as an agent and a Kepler service.
- To setup multiple startup projects, set the Kepler service as the first project and the agent as the second one as follows:
- Click Setup Startup Projects in the drop-down menu.
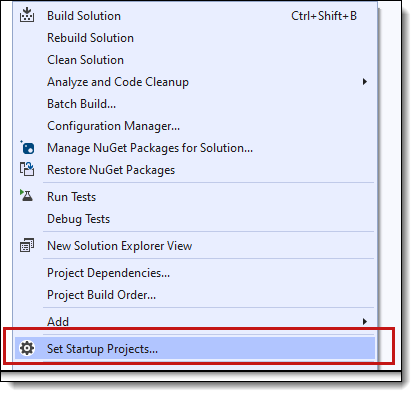
- Select Multiple startup projects list the service and the agent in the appropriate order as follows:
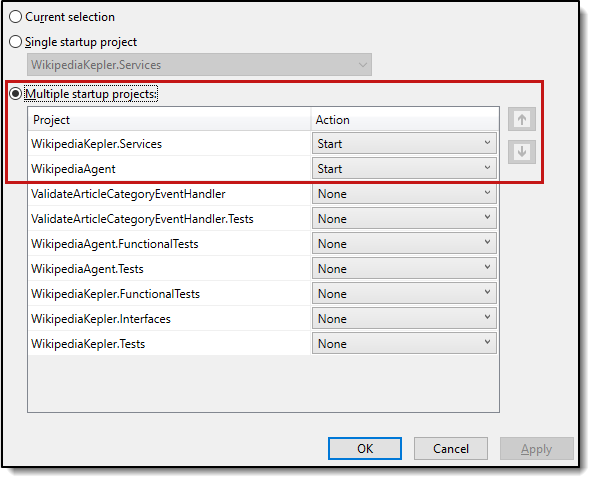
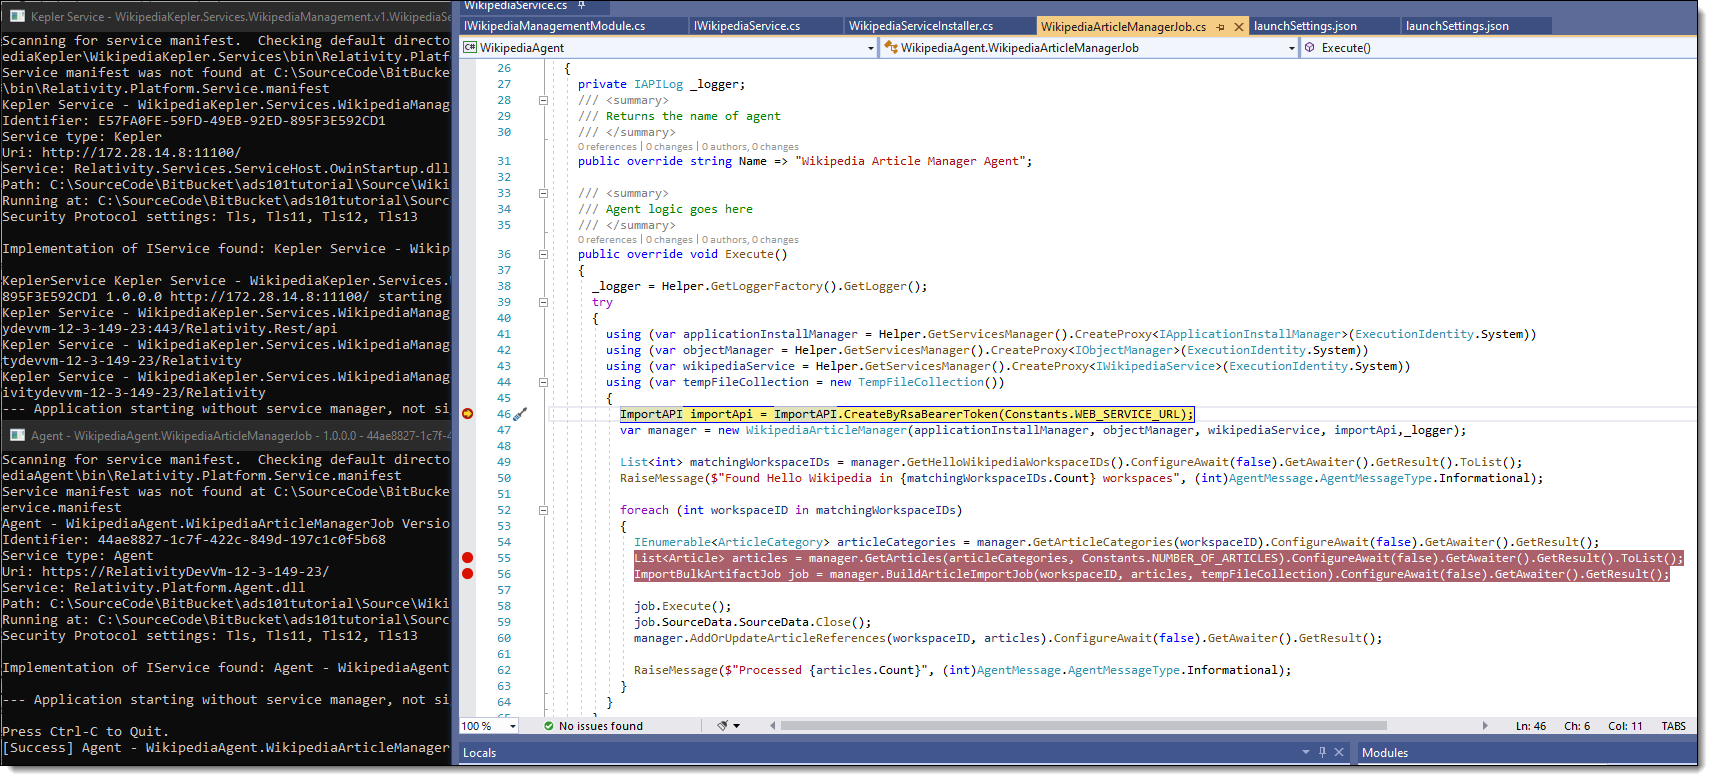
- To start debugging, click the Debug or Run in the Test drop-down menu or press the F5 key. Two command prompts should appear so you can start debugging both the agent and the Kepler service, when the agent reaches the locally hosted Kepler service.
(Click to expand)
Useful folder paths
Use the following folder paths to locate extensions, logs, and other files:
- Visual Studio extension installation location Copy
%LocalAppData%\Microsoft\VisualStudio\<Visual Studio version>\Extensions\ - Local debugger extension root directory
%LocalAppData%\RelativityStudio\-
Local debugger extension logs directoryCopy
%LocalAppData%\RelativityStudio\Logs
Convert to the latest SDK project format
Review the following information about the conversion tool used to update a project to the SDK project format required by Microsoft.
Conversion tool
To update your project, use the conversion tool available in the following GitHub repository: hvanbakel / CsprojToVs2017. This tool is easy to use through PowerShell.
Project conversion steps
The following steps explain how to use the conversion tool to update your project to the required SDK project format.
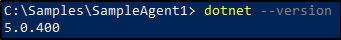
- Verify that you have .NET Core 2.1 or higher version installed on your machine. Use the following command to determine the .NET version in the Command Prompt:
- Install the conversion tool with the following command:
- Restart PowerShell before completing the next step because the installation updates the PATH variable.
- Close before Visual Studio solution before running the conversion tool.
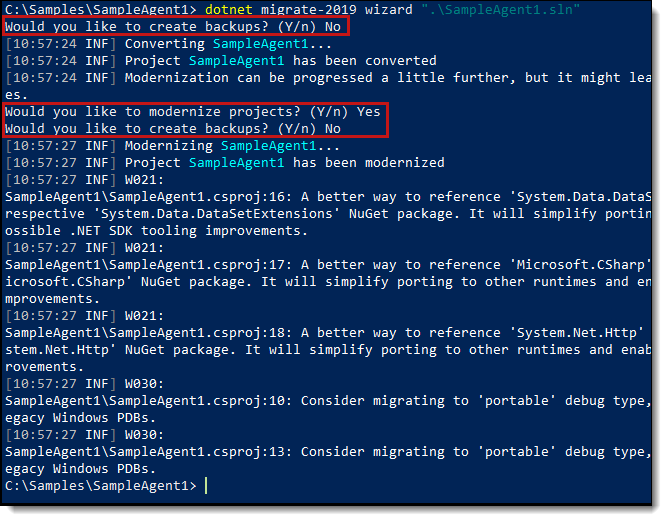
- Run the conversion tool with the following command:
dotnet --version
dotnet tool install --global Project2015To2017.Migrate2019.Tool

dotnet migrate-2019 wizard ".\SampleAgent1.sln"(Click to expand)
Troubleshoot the Local Debugger
Use the following information to troubleshoot the local debugger:
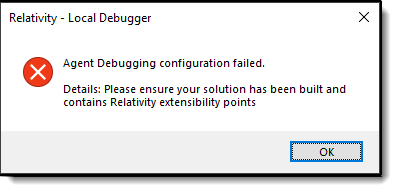
Can't save debugger configuration or refresh agent profile
If you receive the following error message, ensure your solution is built before clicking Save on the Relativity Local Debugger pane or clicking Refresh Agents on the toolbar.
(Click to expand)
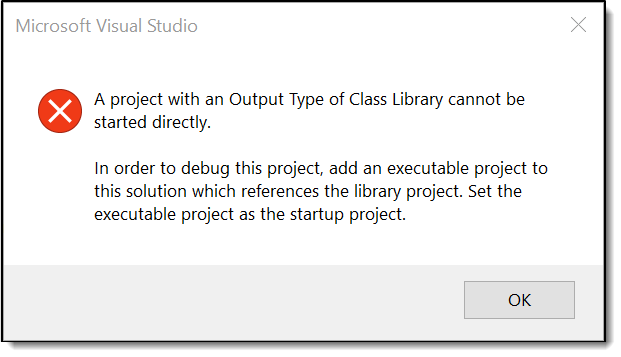
Can't debug an agent
When you attempt to debug an agent by clicking  , the following error message is displayed:
(Click to expand)
To resolve this issue, perform one or more of these tasks:
- If you don't see your agent as an option for debugging, click Refresh Agents on the toolbar. Make sure that your Relativity instance recognizes your agent by uploading it at least once.
- Ensure that you have converted the agent project is converted into the SDK project format. See Convert to the latest SDK project format.
- If you switch branches on your repository after clicking Save on the Relativity Local Debugger pane, rebuild your solution. Click Save again or click Refresh Agents on the toolbar.
